Welcome to Algo Screeners

Algo Screeners is a structured analytical screening platform developed on the UDTS© framework. It offers real-time market screeners, backtesting capabilities, and strategy development tools designed to support systematic study of market behavior across intraday, positional, and long-term perspectives. The platform functions solely as a decision-support and market data analysis tool for educational and informational purposes. It does not provide buy or sell recommendations, stock-specific advice, price targets, stop-loss levels, or any form of investment advisory. Users are solely responsible for their investment and trading decisions.

Next-Gen Intraday Trading with UDTS ROBO – Full Demo Guide Inside!

Playlist

5 Videos

Our Products

At Algo Screeners, we offer advanced yet education-focused market tools designed to help traders understand market behavior, improve decision-making, and build confidence through structured analysis. 

UDTS Robo Screener (View Only – No API Access)
What It Helps You Learn
  • Identify stocks showing specific price-action characteristics
  • Understand bullish and bearish market trends
  • Learn the importance of trend, timing, and market behavior


This platform acts as a learning companion, enabling users to explore how markets move rather than telling them what to trade.

Important Note

UDTS Robo Screener:

  • Does not provide buy/sell recommendations
  • Does not offer investment or trading advice
  • Should not be used as a standalone tool for executing trades

It is best used to support learning in intraday and positional trading, helping users understand how trend and timing influence the market.

Plans

Flexible Plans Are Available Based On Learning Needs And Usage Preferences.

1 Month

UDTS© Robo Screener
999
  •  

3 Months

UDTS© Robo Screener
2400
  •  

6 Month

UDTS© Robo Screener
4500
  •  

12 Month

UDTS© Robo Screener
8100
  •  

UDTS Robo Trader (With Broker API Integration)

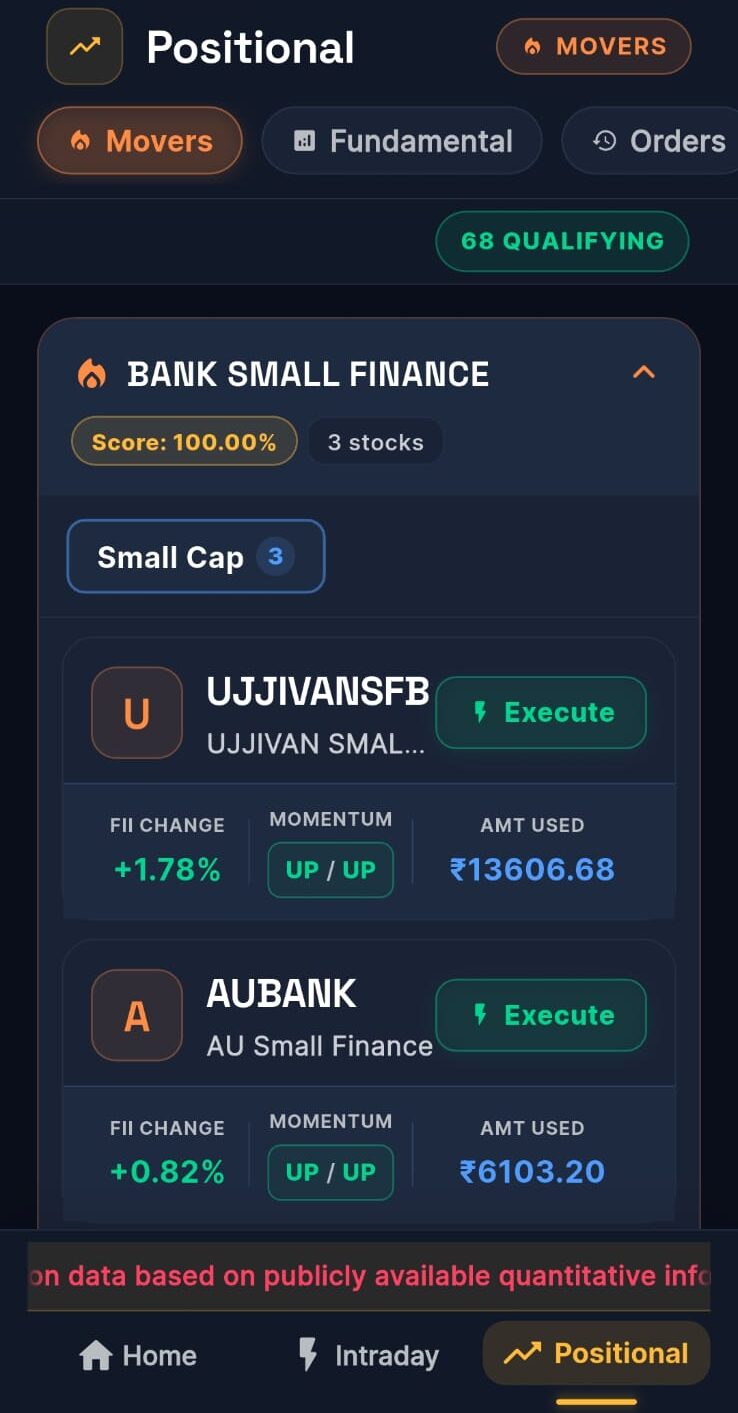
UDTS Robo Trader is an advanced version of the UDTS ecosystem. It includes all features of the UDTS Robo Screener and additionally supports broker API integration for order execution.

This platform allows users to connect their brokerage account and execute trades based on their own analysis, strategies, and decisions.

Key Features
  • All functionalities of UDTS Robo Screener
  • Broker API integration for trade execution
  • Enables rule-based and manual trading support
  • Helps streamline execution alongside analysis
Important Note

UDTS Robo Trader:

  • Does not provide any investment advice or trading recommendations
  • Executes trades only based on user inputs
  • Is intended as a facilitation and analytical tool, not an advisory service


Users are solely responsible for their trading decisions and risk management.

Plans

Multiple plans are available depending on feature access and integration requirements.

1 Month

UDTS© Robo Trader
1499
  •  

3 Months

UDTS© Robo Trader
3600
  •  

6 Month

UDTS© Robo Trader
6750
  •  

12 Month

UDTS© Robo Trader
12150
  •  

Disclaimer

All products are designed strictly for educational, analytical, and facilitation purposes only. Users are advised to make independent decisions or consult a qualified financial advisor before investing or trading in the market.

INTRADAY SCREENER ↴

Intraday Market Analysis Using UDTS© Analytical Platform

beforealgoscreeners

Structured Intraday Trading Starts with Data, Not Guesswork

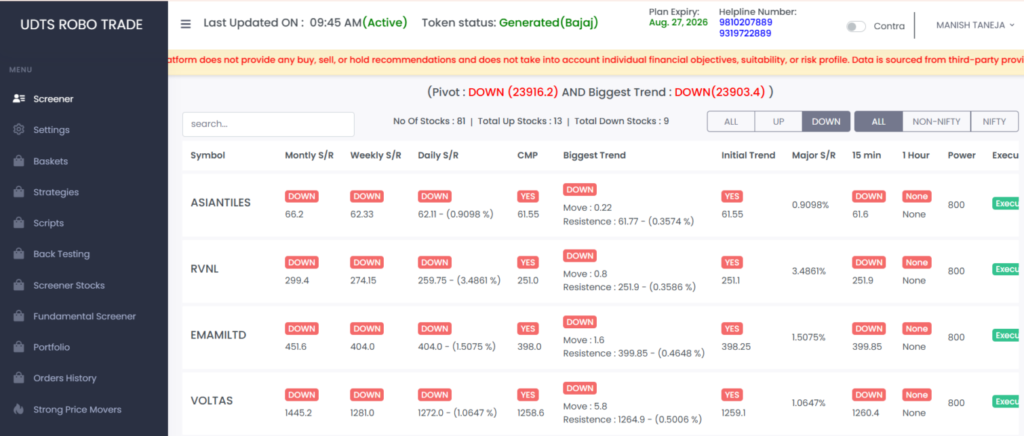
UDTS© ROBO is a rule-based analytical screener designed to help traders identify, analyse, and plan trades using a systematic demand–supply framework.

WHAT IS - UDTS© ROBO

A Smarter Way to Approach Intraday Trading

UDTS© ROBO is a broker-compliant, non-advisory analytical platform that scans stocks based on predefined demand–supply principles and price-action behaviour.

It helps traders ↴

How It Works

Scan the Market

Stocks filtered using rule-based demand–supply logic

1

Understand Context

Market direction via index trends & breadth indicators

2

Plan the Trade

Define entry, stop-loss, and targets

3

Execute Independently

User takes full control of execution

4
Core Features

Rule-Based Screening

Predefined filters to identify structured setups

Multi-Timeframe Analysis

Monthly to intraday alignment for better clarity

Market Breadth Indicators

Index trends + advance-decline insights

Basket Tracking

Monitor multiple stocks simultaneously

Trade Planning Interface

◉ Entry levels
◉ Target levels
◉ Stop-loss (multiple types)

UDTS© - FRAMEWORK

Built on Demand–Supply Logic, Not Predictions

The system analyses↴

Buying vs selling pressure zones

Candlestick-based patterns

Multi-timeframe alignment

Structured screening filters

Designed to assist analysis, not forecast outcomes

Key Benefits

Structured Decision Support

Transforms raw data into actionable insights

Discipline-Oriented Trading

Encourages predefined risk management

Flexible Usage

Suitable for traders and learners

Time Efficiency

Reduces manual chart scanning

Product Overview

UDTS© ROBO Trade is a rule-based algorithmic execution system designed to support structured intraday trading through predefined parameters and user-controlled configurations. The platform integrates analytical screening with automated execution capabilities, enabling users to participate in the markets using a disciplined, system-driven approach. The system :  ↴

Trust / Compliance

Important Note

UDTS© ROBO is a data analytics and execution-support tool.

No Stock Recommendations

No Trading Calls

No Return Assurance

Trade with Structure,
Not Emotion

Start Using UDTS© ROBO Today

FUNDAMENTAL SCREENER ↴

Positional & Long-Term Investment Insights Using UDTS© Fundamental Screener
(VSM Framework)

Compare Stocks Smarter with Value • Safety • Momentum

UDTS©-VSM is a structured analytical framework designed for sector-wise comparison using fundamental data and momentum indicators.

WHAT IS - UDTS© VSM

A Structured Approach to Fundamental Analysis
UDTS©-VSM helps investors interpret financial data through a simplified and comparative framework. It enables ↴
Three Pillars

Value (CV)

Compare valuation across sector peers

Safety (CS)

Assess financial strength and stability

Momentum

Track price behaviour and trend participation

How It Helps

Sector-Based Analysis

No isolated decisions—compare within industry

Simplified Data Interpretation

Complex ratios made easy

Combined View

Valuation + Risk + Momentum

Structured Learning Tool

Ideal for self-directed investors

Product Classification

UDTS© Fundamental Screener is a non-advisory, rule-based market data analytics platform developed for informational and educational purposes only.

The platform: ↴

How UDTS©-VSM Works

Let’s Take an example if we want to compare or want to select the best LARGE CAP stock out of four peer stocks for long positional trading or Investments in AUTO SECTOR on Quantitative & Technical parameters:-

Momentum :

According
to Value Score (CV)

Hero Moto has highest VALUE SCORE (71) Eicher has lowest VALUE SCORE - (56)

According
to Safety Score (CS)

Bajaj Auto has highest SAFETY SCORE (106). Hero Moto + M & M has lowest SAFETY SCORE (90 )

According to Safety + Value Score (CVS)

Bajaj Auto has best VALUE & SAFETY SCORE(175) M&M has lowest VALUE & SAFETY SCORE(147)

According
to Momentum

All Have High Upward Momentum

[Green].

Conclusion

Out of 4 Large Caps of AUTO SECTOR all have high upward momentum but Bajaj Auto has the highest CVS score of 175 and it has upward momentum too. So we can say BAJAJ AUTO is the stock with the HIGHEST VALUE & SAFETY SCORE and is rising in price. Now you can focus your further research on this stock. This way you can save your time on making fundamental outlooks for a particular stock. 

Let’s Check the final scores of stocks now:

(SAFETY & VALUE SCORES ARE GIVEN FOR COMPARISON OF STOCK FROM ITS PEERS. SCORES DO NOT INDICATE OR ADVISE ANY BUYING OR SELLING. SCORES ARE GIVEN ONLY FOR REFERENCE PURPOSES ONLY.)

UDTS-VSM helps in making your Fundamental Research easier & saves your time & effort.

Also read about: What is Fundamental Analysis?

Who is it for
Positioning Statement

UDTS©-VSM is a decision-support and learning tool, not an advisory service. It helps users structure their research using publicly available data.

Important Disclaimer

👉 Explore UDTS - VSM Now

Make Informed Investment Decisions with Structured Data

UDTS® Analytical Platform – Intraday Market Data & Execution Interface

Product Classification

UDTS® Analytical Platform is a non-advisory, technology-based market analytics and execution interface designed for informational and educational purposes only.

The platform:

  • Does NOT provide buy/sell recommendations
  • Does NOT provide stock-specific advice or opinions
  • Does NOT suggest entry, exit, stop-loss, or target levels
  • Does NOT offer any form of investment or trading advisory services


The platform operates strictly as a data processing, visualization, and user-directed execution tool.

Objective

The objective of UDTS® Analytical Platform is to:

  • Provide structured market data filtering and visualization tools
  • Enable users to analyze publicly available market data using customizable parameters
  • Facilitate user-initiated order placement through broker-integrated APIs


All outputs are system-generated based on user-selected filters and are intended solely for self-directed market study and decision-making.

Platform Structure

The platform consists of two independent components:

A – UDTS Screener (Analytical Module – Non-Advisory)

The UDTS Screener is a rule-based data filtering tool that allows users to:

  • Apply customizable filters on market data (e.g., price, volume, timeframes)
  • View filtered lists of securities based on selected conditions
  • Analyze multi-timeframe data representations


Key Characteristics:

  • No ranking, scoring, or prioritization of securities as “best” or “recommended”
  • No identification of trading opportunities
  • No predictive or forward-looking statements
  • No interpretation or opinion provided by the system


All outputs are neutral, condition-based data results.

B – Order Execution Interface (Broker API Integration)

  The execution module is a technology interface that:

  • Connects user accounts to their registered brokers via APIs
  • Enables manual placement of orders by the user
  • Executes trades only upon explicit user action and confirmation


Key Characteristics:

  • No automated or system-triggered trade execution
  • No strategy-based or condition-based order initiation
  • No intervention in user decisions
  • Functions strictly as an order routing mechanism


User Control & Responsibility
  • All filters, parameters, and actions are fully defined and controlled by the user
  • The platform does not create, modify, or suggest any trading logic
  • Users independently interpret all data outputs
  • All trading decisions, order placements, and risk management are solely the user’s responsibility


Data & Output Nature
  • Outputs are generated based on predefined mathematical and logical conditions selected by the user
  • The platform does not apply judgment, opinion, or advisory overlays
  • Displayed information should be treated as raw analytical data, not as guidance or recommendation


Compliance Positioning

UDTS® Analytical Platform is positioned strictly as:

  • A market data analytics tool
  • A user-driven filtering system
  • A broker-integrated execution interface


It does NOT fall under:

  • Investment Advisory services
  • Research Analyst services
  • Portfolio Management services


as defined by the Securities and Exchange Board of India, since:

  • No advice or recommendations are provided
  • No client-specific or general trading opinions are offered
  • No model portfolios or strategies are distributed


Risk Disclosure
  • Financial markets are subject to market risks and volatility
  • Use of analytical tools does not guarantee accuracy or outcomes
  • Past data or filtered results do not indicate future performance
  • Users may incur losses, including loss of capital


No Advisory / No Assurance Clause
  • The platform does not provide investment or trading advice
  • The platform does not recommend any securities or trades
  • The platform does not assure returns or profitability
  • The platform does not provide risk-reward assessments


All usage is strictly self-directed and discretionary.

Important Clarification

UDTS® Analytical Platform:

  • Does not identify trading opportunities
  • Does not guide trading behavior
  • Does not influence decision-making beyond displaying filtered data

It is purely a technology infrastructure layer for data analysis and order execution.

Conclusion

UDTS® Analytical Platform is a non-advisory, user-controlled analytical and execution interface that enables market participants to:

  • Filter and view market data using custom conditions
  • Independently interpret outputs
  • Execute trades through their own broker accounts

The platform maintains a strict non-advisory framework, ensuring that all decisions and actions remain entirely with the user.

UDTS® Fundamental Screener – Market Data Analytics Platform

Product Classification

UDTS® Fundamental Screener is a non-advisory, rule-based market data analytics platform developed for informational and educational purposes only.

The platform:

  • Does NOT provide buy/sell recommendations
  • Does NOT provide stock-specific advice, opinions, or views
  • Does NOT suggest entry, exit, target, or stop-loss levels
  • Does NOT generate trading or investment signals


It functions strictly as a data processing and visualization tool based on predefined, non-discretionary parameters.

Objective

The objective of the platform is to:

  • Enable structured comparison of companies within the same sector
  • Provide standardized presentation of fundamental data
  • Allow users to analyze financial metrics using uniform parameters


All outputs are intended to support self-directed analysis, and not to guide or influence investment decisions.

Data Framework & Processing Logic

A – Data Sources

  • Financial and price-related data are sourced from publicly available and exchange-recognized sources

B – Sector Classification

  • Companies are grouped into predefined sectors for like-to-like comparison
  • No cross-sector interpretation or inference is provided by the system


C – Parameter-Based Analysis

The platform processes data using standard financial metrics, including:

  • Revenue-related figures
  • Profitability ratios (e.g., ROE, ROCE)
  • Earnings indicators (e.g., EPS)
  • Leverage ratios (e.g., Debt-to-Equity)
  • Margin-related metrics
  • Valuation ratios


All parameters are:

  • Predefined and uniformly applied
  • Non-adjustable by the system in a discretionary manner


D – Data Normalization & Presentation

  • Financial data is standardized for comparability purposes only
  • Outputs are displayed in a structured and consistent format
  • Any numerical representation reflects mathematical processing only, without interpretation


⚠️ The platform does not assign qualitative labels such as “good”, “best”, or “favorable”.

E – Price Data Overlay (Informational Layer Only)

  • The platform may display price-related data or trend representation
  • This is presented strictly as historical and visual information
  • It does not indicate future movement, prediction, or trading view

Output Nature

The platform provides:

  • Sector-wise grouped data
  • Parameter-level financial information
  • Standardized comparative tables


Important:

  • Outputs are purely data-driven and non-interpretative
  • The platform does not highlight, prioritize, or recommend any security
  • No “top picks”, “best performers”, or “investment ideas” are generated

User Role & Responsibility
  • Users independently review and interpret all data
  • The platform does not influence user decisions
  • No alerts, nudges, or prompts are provided


All investment or trading decisions are entirely at the user’s discretion and responsibility.

Compliance Positioning

UDTS® Fundamental Screener is positioned strictly as:

  • A market data analytics tool
  • A financial information structuring platform


It does not qualify as:

  • Investment Advisory services
  • Research Analyst services
  • Portfolio Management services


as defined by the Securities and Exchange Board of India, since:

  • No recommendations or opinions are provided
  • No research reports or stock-specific views are generated
  • No model portfolios or investment strategies are offered

Risk Disclosure
  • Financial markets are subject to risks and uncertainties
  • Data-based comparisons do not indicate future performance
  • Accuracy depends on source data and market conditions
  • Users may incur losses, including loss of capital

No Advisory / No Signal Clause
  • The platform does not provide investment or trading advice
  • The platform does not generate signals or recommendations
  • The platform does not assure returns or performance outcomes
  • The platform does not provide risk-reward assessments


All outputs are informational in nature only.

Important Clarification

UDTS® Fundamental Screener:

  • Does not identify investment opportunities
  • Does not guide or influence investment decisions
  • Does not provide forward-looking opinions or views

It operates strictly as a neutral data analytics interface.

Conclusion

UDTS® Fundamental Screener is a non-advisory analytical platform that enables users to:

  • Access and compare structured financial data
  • Analyze companies within a standardized framework
  • Make independent, self-directed decisions


The platform maintains a strict non-advisory and compliance-oriented framework, ensuring complete user control and responsibility.